
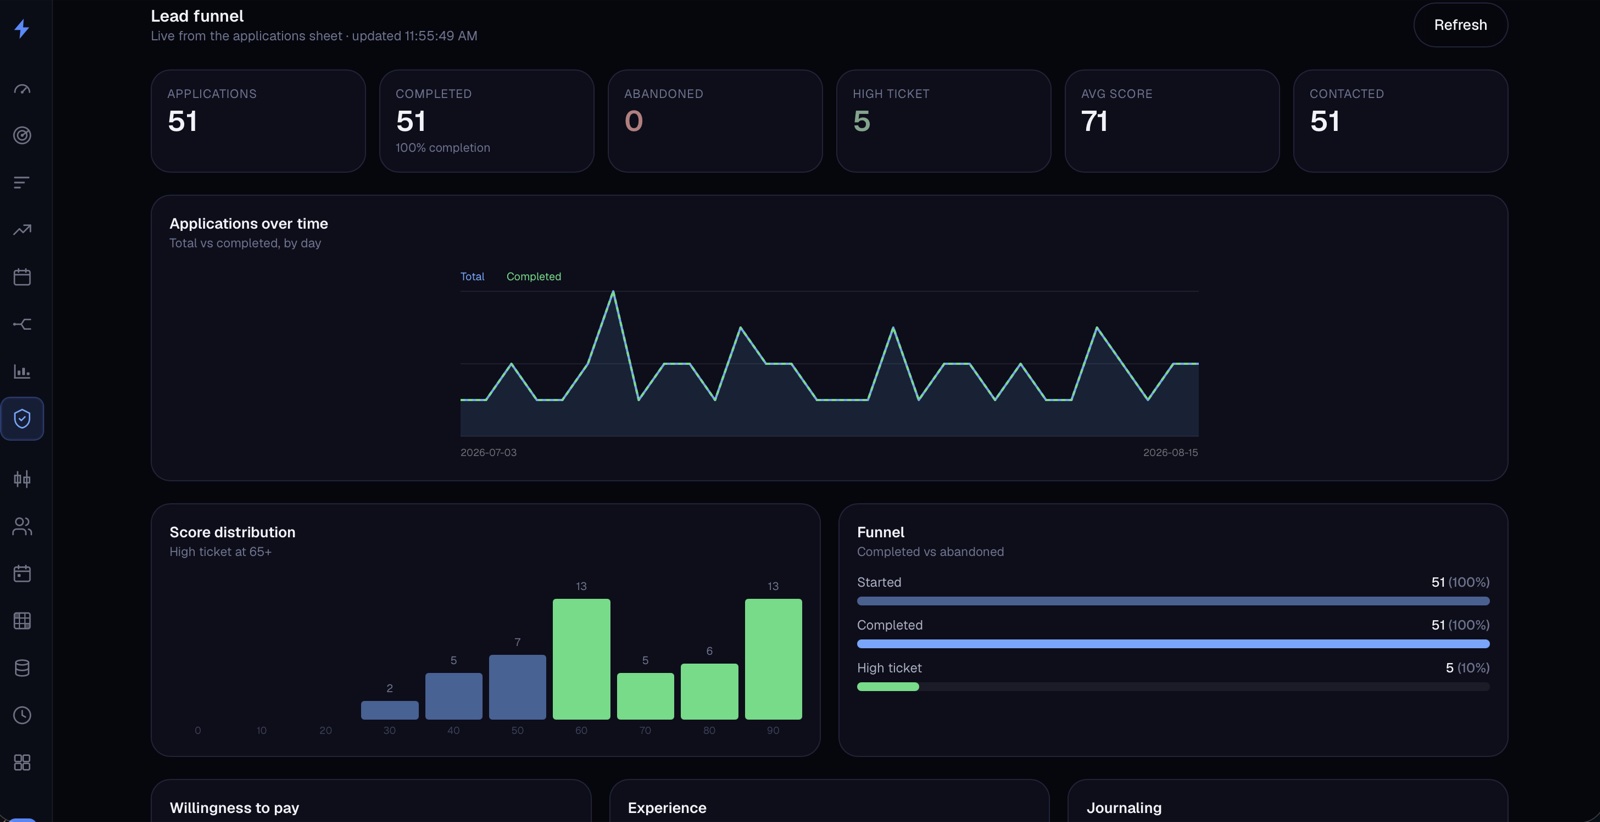
A custom CRM and KPI terminal that updates itself. One screen for the whole funnel.
The problem
The lead data existed, but reading it meant opening sheets and stitching numbers together by hand. I wanted one screen that answers "how is the funnel doing" the moment it loads, without anyone maintaining it.
What I built
A custom dashboard UI that pulls live from the same pipeline the lead engine writes to. Lead volume, scoring splits, and follow-up status, refreshed automatically. Built to be extended: the same pattern can sit on top of QuickBooks, a CRM, or any data source a business already has.
The key decision
Boring, trustworthy data over clever features. Every number on screen traces to a single source of truth, so the dashboard never disagrees with the sheet. If people catch a dashboard lying once, they never trust it again.
Results
Checking the funnel went from opening multiple tools to one screen that's always current.
Copyright © 2026 Jay Robertos. All rights reserved.